|
The world is warming. It is warming because human activity is adding greenhouse gases in the atmosphere that is trapping heat energy. But this rise in temperature is happening so slowly that most of us won’t notice directly. After all, the temperature changes from day to day, from hour to hour is often far greater than the average temperature change from year to year. And the difference from one year to the next can be huge. We risk becoming like the proverbial frog in the pot of slowly boiling water, experiencing and adapting to incremental changes in climate until, like the boiled frog, we find ourselves on a planet that is becoming largely uninhabitable to humans.
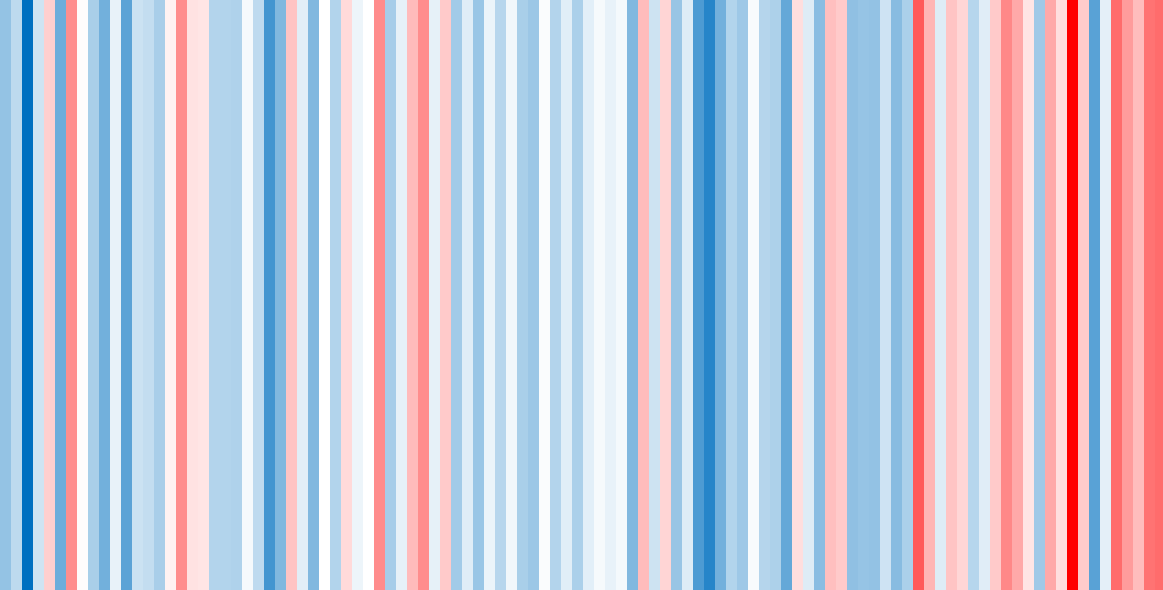
It is hard to become passionate about transitioning our society away from fossil fuels when you don’t feel the impacts of climate change in your daily life. Sure, extreme weather events can be wake-up calls to our changing climate, but these are also times when our world view shrinks to the here and now: finding loved ones, shelter, food… And once the crisis is over, all we want to do is get back to the comfort of normal routines. Many survivors even resist thinking that what they experienced could happen again and could be linked to their every day activity. Change is hard, change is scary, change comes with risks and uncertainties. Talking about climate change, making climate change a personal and political priority, changing our lifestyle to cut fossil fuel use: these things are hard. One thing that can help is to find new, more accessible ways to show climate change and new ways to talk about it. For those who are maybe a little afraid of math, graphs numbers and statistics can be alienating. That is why I was captivated by the climate stripes representation of global temperature rise developed by Ed Hawkins. Each stripe represents a year moving from the earliest year for which there are records on the left to the most recent year on the right. The colour of each stripe represents the average annual temperature, with the coldest year on record being dark blue, hottest being dark red, and all other years being scaled between the two colours depending on their average annual temperature. It is a beautiful visualization of the change in average annual temperature: one that is far more intuitively meaningful to me than the comparable graph. I decided to create a climate stripe representation of the average annual temperatures for the Waterloo Region, using instructions obtained from a Youtube video. Since there are no weather stations that have collected data continuously for more than a few decades, I had to use data from several weather stations, some of which had incomplete data sets. I used the Kitchener weather station for 1915-1977, the nearby Roseville weather station for 1978-2020. Although all located in the Waterloo region, the change in location can be expected to have some impact on average annual temperatures. However, the trend of increasing temperatures is real: climate change is happening here too. If we don’t want to be that frog in the slowly boiling water, we had better spread the word and embrace the necessary changes.
0 Comments
 Photo by Josh Hild from Pexels Voluntary simplicity was a popular topic at one time. There were books written on the topic, simplicity circles sprang up, and David Thoreau became a household name for a while. The basic idea behind voluntary simplicity is that you can gain more meaning in your life by simplifying your possessions, your activities, your lifestyle choices down to the those that have the most value to you. This frees your mind and your time to focus on what really matters to you. It came to be associated with minimalist lifestyles, self-sufficiency, frugality. Marie Kondo’s approach to reducing possessions to only those that “spark joy” is a more recent manifestation of this idea that less is more. But to me, living simply is not about giving things up or seeking meaning in everything I own. It is about living mindfully. By that, I mean identifying my core values and living my life in alignment with those values. It means examining my choices through the lens of those values. Sometimes it means giving things up, and sometimes it means investing more time, money and effort into something that I cherish. One of my core values is environmentalism: the belief that I have a responsibility to nurture and protect the natural systems that support life in a way that allows these systems to function for generations to come. My climate activism sprang out of that environmentalist core value since human activity is disrupting our climate to such a degree that it is threatening the long term survival of humans and other life forms. Air travel for leisure, for example, is not consistent with my core value of protecting our climate so I have chosen to forgo that pleasure. That decision was hard, but it is made easier because I know that it is a decision that is true to who I am and who I wish to be. On the flip side, I have chosen to spend extra money, time and resources on insulating my basement. Not only does that reduce my carbon footprint, but it also makes my home more comfortable to live in: something else that I value. While my decisions are right for me, they may not be for others with other life priorities. My hope, however, is that our society will increasingly come to value climate change mitigation and will begin to prioritize the choices that are consistent with that value. The Working Centre here in Waterloo Region has put out a study guide for simplicity circles. It has readings, activities, and guides for facilitated discussions that are designed to take place in ten sessions. It is ideal for a group of 4-10 people who are committed to honestly exploring how they live their life in an environment of mutual support. It can be difficult and it can be incredibly rewarding. I have participated in such a circle twice now and each time I gained a deeper understanding of myself and my fellow travelers on the path. It feels good to know that I am living a life that is true to who I am, a life that supports a safe climate future, a life that may not be minimalist but is mindful. Did you know that you can cut your carbon footprint in the bathroom too? The main source of greenhouse gas emissions in the bathroom relates to water, and especially hot water. The more water you use, the bigger your footprint. And we in Canada have big water footprints: we use, on average, 251 L of water per person per day in our homes (2011 data[1]). Have you seen those big cubic containers surrounded by a metal cage at construction sites, on trucks and elsewhere? We each use, on average, enough water to fill one of those tanks every four days in Canada for our personal needs. Our residential hot water heaters are often powered with natural gas, a fossil fuel that generates carbon dioxide when it burns to heat the water. Also common are electric hot water heaters that also have a carbon footprint since roughly 10% of our electricity in Ontario is generated using fossil fuels. If you live in an apartment building, added energy is used to bring water up to all floors. And don’t forget the energy it takes to filter, treat, and distribute the clean water plus the energy to collect and treat the waste water. It all adds up. And while we can get very efficient on-demand hot water heaters, heat pump water heaters, and solar hot water systems, the easiest and cheapest way to cut our bathroom carbon footprint may be by cutting back on our water usage. Along the way, you may see savings on your water and utility bills too. That sounds like a win-win to me! Here are some simple ways to cut back on water use:
Here in the Region of Waterloo, single family homes that use more than 4.5 cubic meters of water per person per month can get a free home water consultation to check for water issues or leaks and offer suggestions for how to become more water efficient. Taking action matters as it brings us one step closer to building a sustainable world for our children and all life to come. [1] https://www.canada.ca/en/environment-climate-change/services/environmental-indicators/residential-water-use.html  Conventional wisdom says that when it comes to heating homes, natural gas is dirt cheap and electricity is ruinously expensive. But for newer homes, that thinking may be wrong. Currently, natural gas energy is indeed 5.5 times cheaper than electric energy for residential customers in Waterloo Region (and both are cheap in a world and continental context[1]). But well insulated homes and newer heat pump technology change make a world of difference. When we are talking about heating, most homes in the Waterloo Region use natural gas furnaces. These have an efficiency of 60-98%, depending on the age and the model. Newer cold climate air source heat pumps, on the other hand, can have an average efficiency of 300%. That means that for every unit of electric energy you buy, your home gains three units of heat energy using the same technology that keeps your fridge cold. This difference in efficiency, combined with the high natural gas fixed delivery charge means that well-insulated homes are cheaper to heat with heat pumps than with natural gas. Let me walk you through the calculations for my 1992 home.
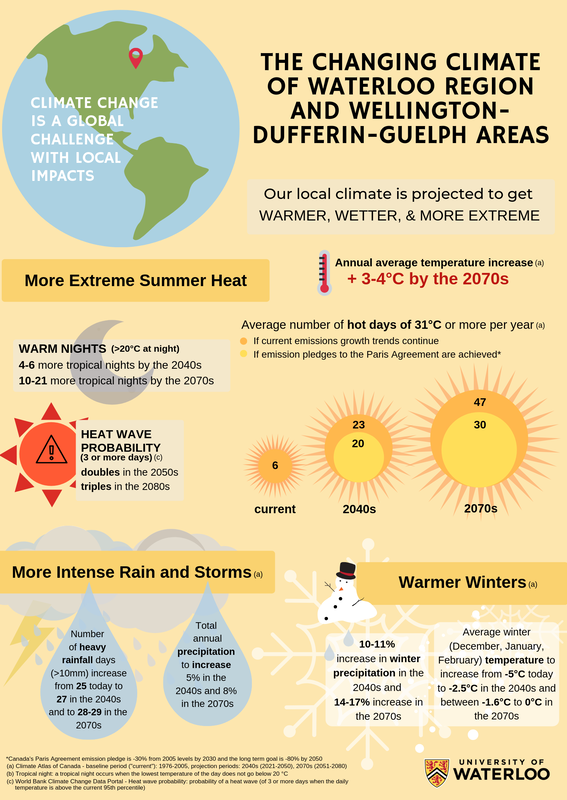
Indeed, electricity may be the cheaper choice for any home that uses less than 1200 m3/yr of natural gas for space heating. But what if natural gas is also used to heat water? My home has an electric water heater so I did the same calculations as above assuming a switch from a high efficiency gas water heater to a heat pump water heater and assuming average hot water use[2]. That put electricity as the cheaper option for space and water heating by $3/yr. A newer home with more insulation and some basic water efficiency measures will most assuredly do better. The implications are huge. Homes in Waterloo Region generate 18% of the total greenhouse gas emissions and must transition to electrified heat and hot water before mid-century if we are to meet our climate goals. Furnaces and water heaters last for years, even decades so we must ensure that decisions made now do not lock us in to fossil fuel-based equipment for decades to come. Fortunately, as demonstrated above, it is operationally cost-effective to do so now for many of our homes. New builds, where expensive natural gas infrastructure has not been laid down is an obvious place to start. Dozens of communities across North America have already banned natural gas in new construction[3]. For existing homes, Vancouver is leading the way: by 2025, all new and replacement heating and hot water systems must be zero carbon[4]. We should start electrifying our home heating systems now! [1] https://www.globalpetrolprices.com/electricity_prices/ [2] https://www.energystar.gov/productfinder/product/certified-water-heaters/results [3] https://e360.yale.edu/features/to-cut-carbon-emissions-a-movement-grows-to-electrify-everything [4] https://vancouver.ca/green-vancouver/climate-emergency-response.aspx The University of Waterloo has put out a handy infographic showing the projected changes to the climate for Waterloo Region and Wellington-Dufferin-Guelph areas. The projections are based on multiple climate models and represent our best current understanding of climate systems.
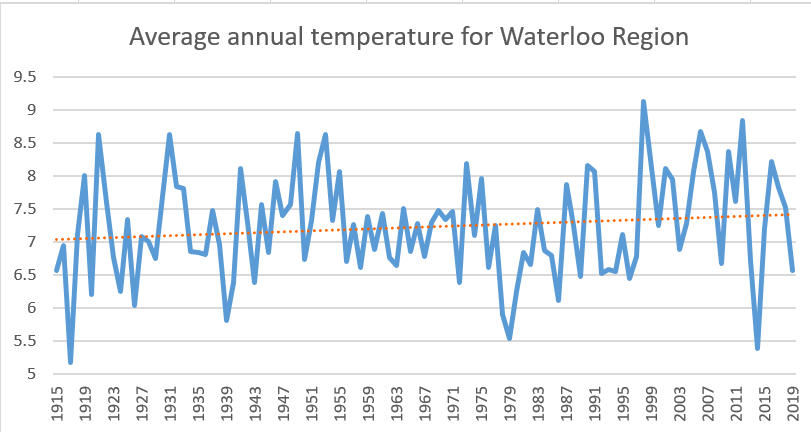
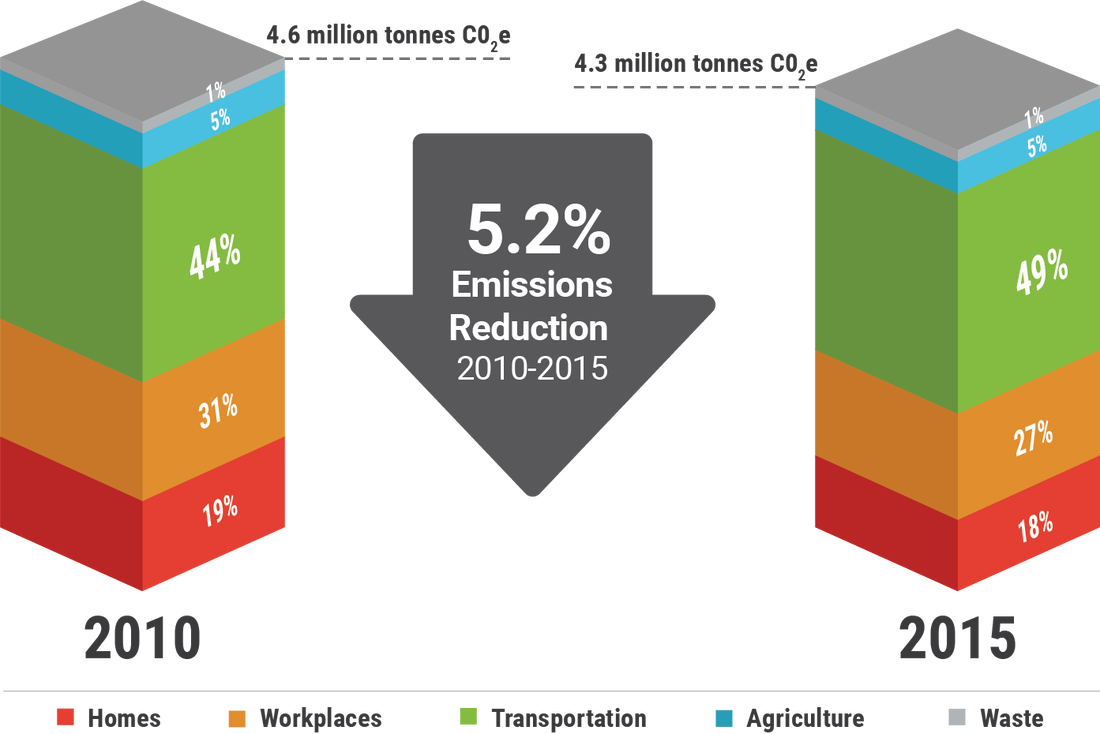
The general message is that we can expect to see warmer, wetter and more extreme weather in the coming decades in our region. How much change we observe still depends on how fast the global community is able to reduce its greenhouse gas emissions. The infographic shows projections that consider both a business as usual scenario and a scenario in which the World meets its Paris Agreement pledges[1]. When it comes to average annual temperatures, we can expect to see a rise of 3-4°C by mid to late century (2051-2080) relative to a baseline period of 1976 to 2005 (climate scientists work with 30 year periods when comparing conditions). Historical temperature readings from local weather stations suggest that we have experienced an average 0.4°C temperature rise since 1915, so this is a significant deviation from what we have already experienced. In the summertime, that rising annual temperature will bring some very hot weather. The average number of days we call very hot (31°C or more) are expected to rise from an average of 6 in recent years, to 20-23 early to mid-century (2021-2050) and 30-47 mid to late century (2051-2080). Those hot days will be accompanied by tropical nights, adding an average additional 4-6 days when temperatures do not fall below 20°C during the day or night by 2021-2040. For later in the century (2051-2080), that number rises to 10-21. Heat waves, defined as three or more days of very high temperatures are set to double and triple by mid and late century. This is a recipe for heat-related illnesses and even death in vulnerable populations: the young, the elderly, the ill, and those without access to air conditioning. Winters will also get warmer in the Waterloo Region. Average winter temperatures are projected to rise from the current -5°C to an average -2.5°C by early to mid-century (2021-2050) and to an average of -1.6°C to 0°C by mid to late century (2051-2080). This will be accompanied by an increase in precipitation (10-11% for 2021-2050 and 14-17% for 2051-2080). Warmer winters and more precipitation likely means more freezing rain and ice storms (my interpretation). And with temperatures increasingly fluctuating above and below the freezing point, it seems likely that there will be less snow accumulation: a forecast that has implications for our crops and our ecosystems. When it comes to precipitation, Waterloo region can expect to see a modest annual increase: 5% for 2021-2050, and 8% for 2051-2080. As noted above, much of that increased precipitation will fall in the winter. In the other seasons, it is expected that more of the precipitation will come in the form of intense storms with the number of heavy rainfall days (>10mm) increasing from the average of 25 today to an average of 27 (2021-2050) then 28-29 (2051-2080). These are the types of intense rain events that can cause rivers to swell, roads and basements to flood, and communities to be thrust into a state of emergency. While the projections for our area are not pretty, we can grateful that we live in an area that is expected to see relatively modest climate change impacts. We will not be directly affected by sea level rise, our region is not expected to become a desert and the projected temperatures are still well within the livable human range. But if we want a good life for ourselves and our children, we will need to do two things. First, we will need to cut our greenhouse gas emissions to near zero by mid-century: climate mitigation. Secondly, we will need to start planning for a different climate: climate adaptation. [1] Canada pledged to cut emissions by 30% below 2005 levels by 2030 and by 80% by 2050. Here in the Region of Waterloo, we have pledged to cut emissions by 6% below 2010 levels by 2020 and by 80% by 2050. This blog post deals with changes that have already occurred in our local climate over the past century. A future post will address the changes in weather patterns that climate models predict are coming to the Waterloo region. Globally, average annual temperatures have risen by 0.8’C since pre-industrial times[1]. But this rise in temperature is not uniform over the whole planet. The poles, for example, have warmed much faster than other regions, including the Region of Waterloo. The graph above shows how average annual temperatures have changed in the region since 1915[2]. Although the change is not dramatic yet, it is clear that temperatures are rising here too. The trendline in the graph above suggests that our average annual temperature has increased by 0.4'C since 1915. But climate doesn’t simply describe annual temperatures, it encompasses precipitation patterns, seasonal transitions, extreme weather events and much more. In the Waterloo region, Climate Atlas shows that we have already, in the last 70 years or so, experienced a rise in very hot days (+30’C), an increase in the frost-free season, a rise in the annual minimum temperature, and many other worrisome trends. You may personally also have noticed changes to our weather patterns here in Waterloo Region. I have observed that there are fewer good ski days in the winters, less snow accumulation, more mid-winter thaws, earlier frost-free days in spring, more erratic precipitation in summer... What about you? Have you experienced long term changes in our Region’s weather patterns? Katherine Hayhoe, climate scientist and climate communicator gave a TEDtalk that has received over 1.9 million views in just over a year. The key message of her TEDtalk: The most important thing you can do to fight climate change is talk about it. Your personal experiences of changing weather patterns may be one of the best ways to start a conversation. [1] https://climate.nasa.gov/vital-signs/global-temperature/ [2] data sourced from Environment Canada website using Kitchener weather station (1915 to 1977), Roseville weather station (1978 to 2010), Kitchener-Waterloo weather station (2011-2019) Image sourced from: http://www.climateactionwr.ca/progress/ mo Waterloo Region is currently working under a plan to reduce community greenhouse gas emissions by 6% below 2010 levels by the end of 2020. The focus areas include transportation, workplaces, homes, agriculture plus food, and waste. The target reduction was chosen because it was deemed to be both ambitious and achievable in a region that has seen significant population growth. It is a relatively conservative target, however: Toronto’s 2020 target, for example, is 30% below 1990 levels and by 2017 had surpassed that target, achieving a 44% reduction in emissions. In 2015, the Region of Waterloo inventory its community emissions and reported a 5.2% drop in emissions. Seems impressive, right? After only 5 years, we had almost reached our target. But you may recall that during this period, provincial legislation forced the closure of coal-fired power plants leading to a 60% drop in emissions from electricity. If we set aside the emissions reduction attributable to cleaning the electricity supply, the Region of Waterloo emissions have increased by 4.4% over that period. It was provincial leadership, not regional or municipal programs that deserves most of the credit. So what has the Region of Waterloo done to mitigate climate change in the community? Not nearly enough. The tri-cities have taken steps to reduce their corporate emissions, we have seen an expansion in public transportation options, active transportation is being facilitated, we now have green bin pickup. But most other programs are voluntary, educational, or aspirational. Change is hard. Looking to the long term, the Region has committed to a target of 80% below 2010 levels by 2050. While less ambitious than the net zero emissions recommended to keep global temperature rise below 1.5'C, this nevertheless represents a target that will require significant leadership from our municipal representatives. It will require municipal regulation, municipal investment, municipal programs, education, incentives and coordinated action with other levels of government. ClimateActionWR is responsible for developing the long term Climate Action Strategy which is to be released in late 2020. In the meantime, it is our role to keep talking about our climate concerns with friends, neighbours, co-workers, municipal leaders: it is the only way to keep the urgent need for climate change mitigation at the forefront of everyone’s mind.
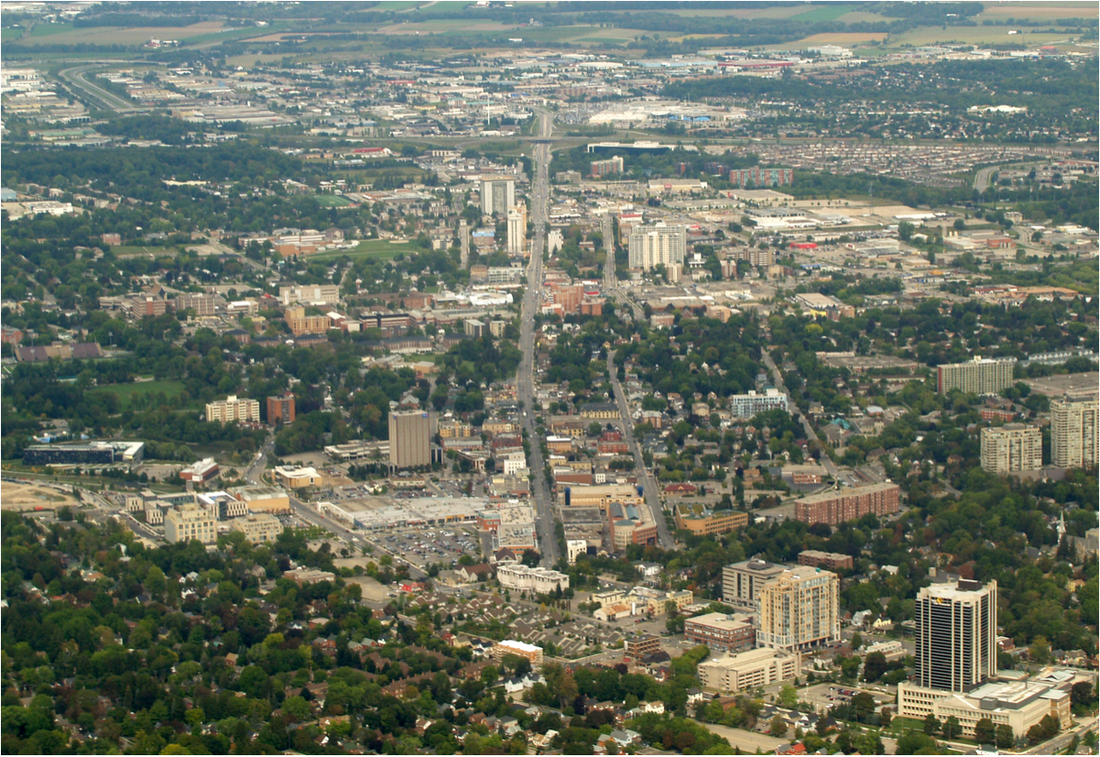
Downtown Waterloo from over Kitchener, taken by Floydian, sourced from https://en.wikipedia.org/wiki/File:Downtown_Waterloo.png It turns out that there has been a lot of planning within the Waterloo Region when it comes to climate change. I have provided links to all of the publicly available plans below, along with a link to the Regional Sustainability Initiative if you want to learn about what other local corporations are doing.
Of course, plans are great but it is actions that count. In future blog posts, I will describe what Waterloo Region has achieved so far and provide some reflections on what it will take to achieve its stated ambitions. But first a word about terminology. There are two types of climate plans: climate mitigation plans deal with strategies for cutting greenhouse gas emissions and climate adaptation plans are designed to build local resilience toward the changes in climate that are projected for the region. There are also two levels of municipal climate action plans: corporate plans deal with the municipality’s own emissions, processes and infrastructure, while community plans deal with the emissions, processes and infrastructure contained within the boundaries of the municipality. Region of Waterloo
City of Kitchener
City of Waterloo
City of Cambridge
Township of North Dumfries
Township of Wellesley
Township of Wilmot
Township of Woolwich
Other Corporate Climate Action Plans
 If you cook with natural gas, greenhouse gases are generated as a direct result of cooking your food. In terms of your carbon footprint, cooking with electricity is an obvious improvement: here in Ontario, our electricity is about 90% carbon-free. But did you know that the type of electric stove can make a difference too? Induction cooktops are more efficient than coil or glass cooktops and therefore use less electricity and generate fewer greenhouse gases.
“What is an induction cooktop?” you might ask. It looks just like a glass cooktop, but rather than having a coil element under the surface that must transfer the heat through the glass to the pot, an induction cooker has an electromagnet under the glass surface. The electromagnet induces a small current and magnetic flux in the pot, causing the pot to heat up directly. This is a more efficient process whereby less heat is lost to the surroundings: a benefit that is much appreciated in the summer months. Indeed, the induction cooker is so efficient that it is safe move a pot that has boiled over to wipe down the glass surface. The advantages of an induction cooktop go far beyond energy efficiency, however. Induction cooktops heat things faster. Much faster. As a science fair experiment, my son timed how long it took to boil 1L of water on several cooktops. The results: 9 minutes on a glass cooktop, 6.5 minutes on a coil cooktop, and just 3 minutes on an induction cooktop. What is more, induction cookers are just as responsive as gas cookers. When you turn up or down the heat settings, the heat generated by the pot changes instantaneously. But unlike gas cookers, there are no open flames or combustion gases to worry about. And induction cookers have temperature settings so low that you can do away with the double boilers, even for chocolate. So, why, you might be wondering, are induction cooktops not the norm? They are increasingly common in Europe and parts of Asia, but they have been slow to take off in North America. Induction cooktops are more expensive than other options, and with electricity prices being so low on our continent, saving energy has not been the priority it has been elsewhere. Also, not all cookware works with induction. Only pots and pans with iron or stainless steel in their base can respond to the electromagnet – if a fridge magnet will stick, the electromagnet can do its magic. I have been cooking with induction for many years now and I cannot imagine going back to anything else. It just goes to show: climate solutions can also make our lives better. |
Archives
January 2021
Categories |

 RSS Feed