|
The world is warming. It is warming because human activity is adding greenhouse gases in the atmosphere that is trapping heat energy. But this rise in temperature is happening so slowly that most of us won’t notice directly. After all, the temperature changes from day to day, from hour to hour is often far greater than the average temperature change from year to year. And the difference from one year to the next can be huge. We risk becoming like the proverbial frog in the pot of slowly boiling water, experiencing and adapting to incremental changes in climate until, like the boiled frog, we find ourselves on a planet that is becoming largely uninhabitable to humans.
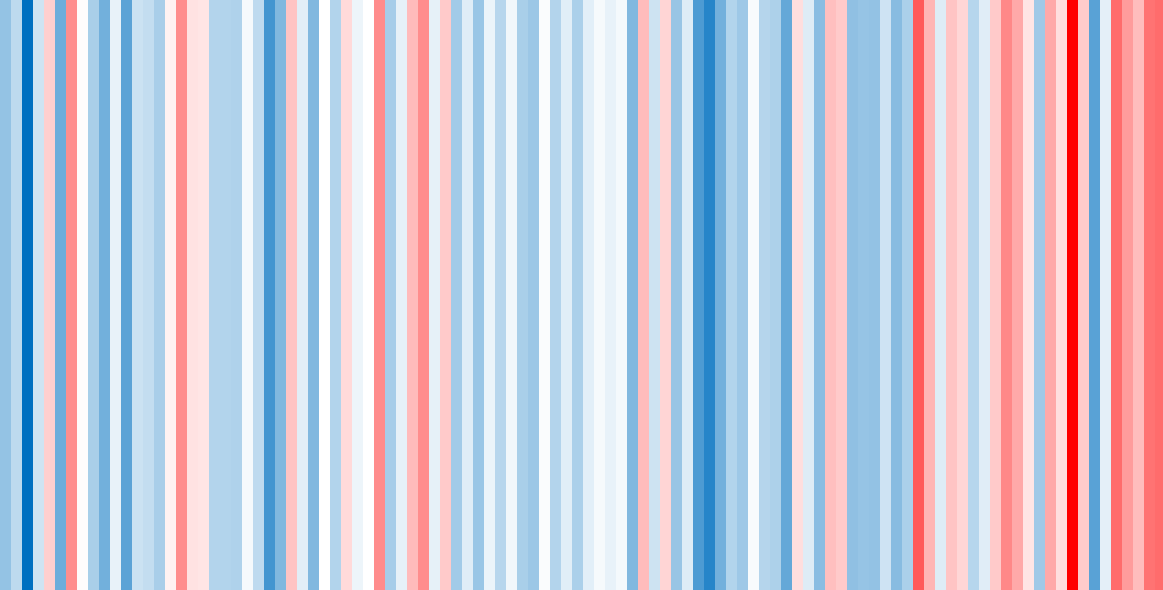
It is hard to become passionate about transitioning our society away from fossil fuels when you don’t feel the impacts of climate change in your daily life. Sure, extreme weather events can be wake-up calls to our changing climate, but these are also times when our world view shrinks to the here and now: finding loved ones, shelter, food… And once the crisis is over, all we want to do is get back to the comfort of normal routines. Many survivors even resist thinking that what they experienced could happen again and could be linked to their every day activity. Change is hard, change is scary, change comes with risks and uncertainties. Talking about climate change, making climate change a personal and political priority, changing our lifestyle to cut fossil fuel use: these things are hard. One thing that can help is to find new, more accessible ways to show climate change and new ways to talk about it. For those who are maybe a little afraid of math, graphs numbers and statistics can be alienating. That is why I was captivated by the climate stripes representation of global temperature rise developed by Ed Hawkins. Each stripe represents a year moving from the earliest year for which there are records on the left to the most recent year on the right. The colour of each stripe represents the average annual temperature, with the coldest year on record being dark blue, hottest being dark red, and all other years being scaled between the two colours depending on their average annual temperature. It is a beautiful visualization of the change in average annual temperature: one that is far more intuitively meaningful to me than the comparable graph. I decided to create a climate stripe representation of the average annual temperatures for the Waterloo Region, using instructions obtained from a Youtube video. Since there are no weather stations that have collected data continuously for more than a few decades, I had to use data from several weather stations, some of which had incomplete data sets. I used the Kitchener weather station for 1915-1977, the nearby Roseville weather station for 1978-2020. Although all located in the Waterloo region, the change in location can be expected to have some impact on average annual temperatures. However, the trend of increasing temperatures is real: climate change is happening here too. If we don’t want to be that frog in the slowly boiling water, we had better spread the word and embrace the necessary changes.
0 Comments
|
Archives
January 2021
Categories |


 RSS Feed